Eduardo Vitral
Research
Software and tools
BALROGO: Bayesian Astrometric Likelihood Recovery of Galactic Objects
 BALRoGO GitLab repository:
click here
BALRoGO is an open source Python software I created, that performs different
aspects of dynamical modeling of galactic satellites such as globular clusters (GCs)
and dwarf spheroidal galaxies (dSphs). It employs Bayesian fits of bulk proper motions,
surface density, volume density, center, total mass and velocity anisotropy of
both observed and simulated data. In addition, it has straightforward tools
to perform sky coordinate transformations, as well as to define confidence
regions in color-magnitude diagrams.
BALRoGO GitLab repository:
click here
BALRoGO is an open source Python software I created, that performs different
aspects of dynamical modeling of galactic satellites such as globular clusters (GCs)
and dwarf spheroidal galaxies (dSphs). It employs Bayesian fits of bulk proper motions,
surface density, volume density, center, total mass and velocity anisotropy of
both observed and simulated data. In addition, it has straightforward tools
to perform sky coordinate transformations, as well as to define confidence
regions in color-magnitude diagrams.
I warmly invite you to download the code and give it a try, and of course,
message me if you have any questions!
Please cite
us
if you find this code useful in your research:
@ARTICLE{Vitral21,
   author = {{Vitral}, Eduardo},
    title = "BALRoGO: Bayesian Astrometric Likelihood Recovery of Galactic Objects - Global properties of over one hundred globular clusters with Gaia EDR3",
  journal = {\mnras},
     year = 2021,
    month = jun,
   volume = {504},
   number = {1},
    pages = {1355-1369},
      doi = {10.1093/mnras/stab947},
   eprint = {2102.04841},
   adsurl = {https://ui.adsabs.harvard.edu/abs/2021MNRAS.504.1355V},
}
BALRoGO is available through pip. The quickiest way to install it is to type the following command in your terminal:
pip install balrogo
If you are using Anaconda, you might want to install it directly in your Anaconda bin path:
cd path/anaconda3/bin/
pip install balrogo
pip install balrogo, you should type:
pip install --upgrade balrogo
scalefree: Scale-free Kinematical Modeling Software
I am a contributor of the scalefree software, and have implemented the equations for plane-of-sky coordinates. I currently host the code repository at my GitLab account, and you can access it by clicking here. The README.md file in the repository describes how to install and use the software with Python.
Proper motion space
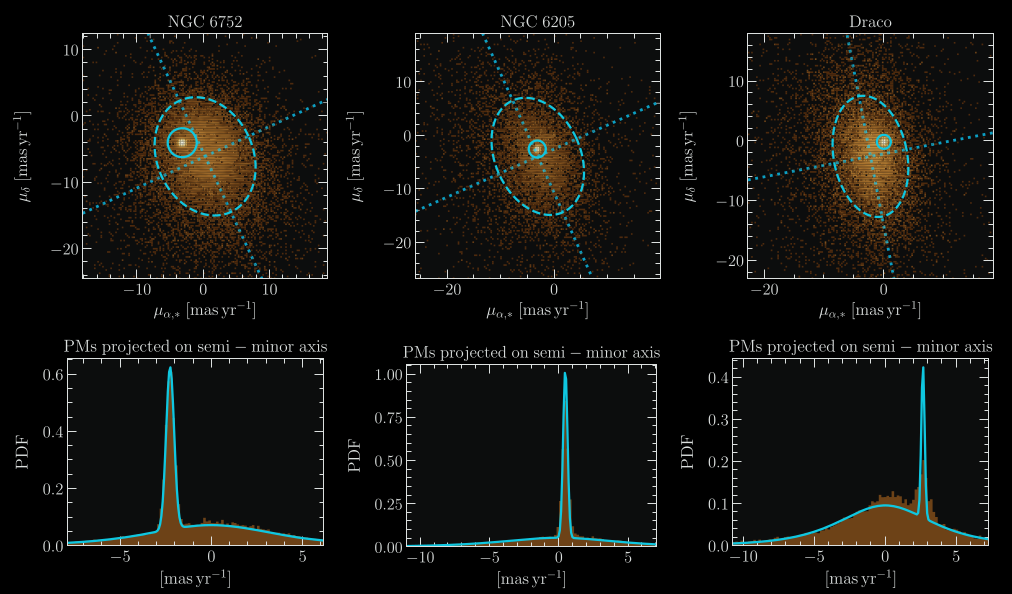 Goodness of fit of the proper motion distribution of galactic
satellites (GC or dSph) plus Milky Way interlopers, applied
to Gaia EDR3 data. While the satellite’s proper motions follow a
normal Gaussian, the Milky Way interloper's proper motion PDF is
not Gaussian, and is much better fitted by a Pearson VII distribution.
Image credits: Figure from Vitral (2021).
Goodness of fit of the proper motion distribution of galactic
satellites (GC or dSph) plus Milky Way interlopers, applied
to Gaia EDR3 data. While the satellite’s proper motions follow a
normal Gaussian, the Milky Way interloper's proper motion PDF is
not Gaussian, and is much better fitted by a Pearson VII distribution.
Image credits: Figure from Vitral (2021).
Although the probability density function (PDF) of proper motions from Milky Way interlopers has been assumed to follow a Gaussian shape in many Gaia DR2 related studies, I have helped to show that this proper motion distribution has wider wings than a Gaussian, and it is much better modeled by a Pearson VII asymmetric distribution: $$\mathrm{PDF_{MW}} = \displaystyle{ \left[ \frac{\Gamma{\left( - \frac{1}{2} - \frac{\tau}{2} \right)}}{\Gamma{\left(-1 - \frac{\tau}{2}\right)}} \right]^{2} \, \frac{ \left\{ \left[1 + \left(\frac{\mu_{x}}{a_{x}}\right)^{2} \right] \, \left[1 + \left(\frac{\mu_{y}}{a_{y}}\right)^{2} \right] \, \right\}}{ \pi \, a_{x} \, a_{y}} }^{(1 + \tau)/2} \ .$$
Another equivalent form of this function that is better adjusted at large proper motion values (the formula above displays undesirable diamond-like shapes in this regime) can be written as: $$\mathrm{PDF_{MW}} = \displaystyle{-\frac{(3 + \tau)}{2} \, \frac{ \left[1 + \left(\frac{\mu_{x}}{a_{x}}\right)^{2} + \left(\frac{\mu_{y}}{a_{y}}\right)^{2} \right]}{ \pi \, a_{x} \, a_{y}} }^{(1 + \tau)/2} \ .$$
I have applied the former formalism to derive bulk proper motions of over a hundred GCs and nine Local Group dwarf spheroidals. A complete table with the values of bulk proper motions, centers and other structural parameters can be accessed here:
Sérsic deprojection
The Sérsic model shows a close fit to the surface brightness (or surface density) profiles of elliptical galaxies and galaxy bulges, and possibly also those of dwarf spheroidal galaxies and globular clusters. The deprojected density and mass profiles are important for many astrophysical applications, in particular for mass-orbit modeling of these systems. However, the exact deprojection formula for the Sérsic model employs special functions that are not available in most computer languages.I helped to derived a more precise analytical approximation to the deprojected Sérsic density and mass profiles by fitting two-dimensional tenth-order polynomials to the residuals of the analytical approximations by Lima Neto et al. (1999, MNRAS, 309, 481, LGM) for these profiles: $$f_{\rm new}(x,n) = f_{\rm LGM}(x,n) \ {\rm dex}\left[\sum_{i=0}^{10}\sum_{j=0}^{10-i} a_{i,j}\log^i x\,\log^j n \right] \ .$$
where f can be both the density or mass profiles (with respective different values for ai,j). As it can be seen in the figure below, our approximation is the best one for low Sérsic index (i.e., n < 3.4).
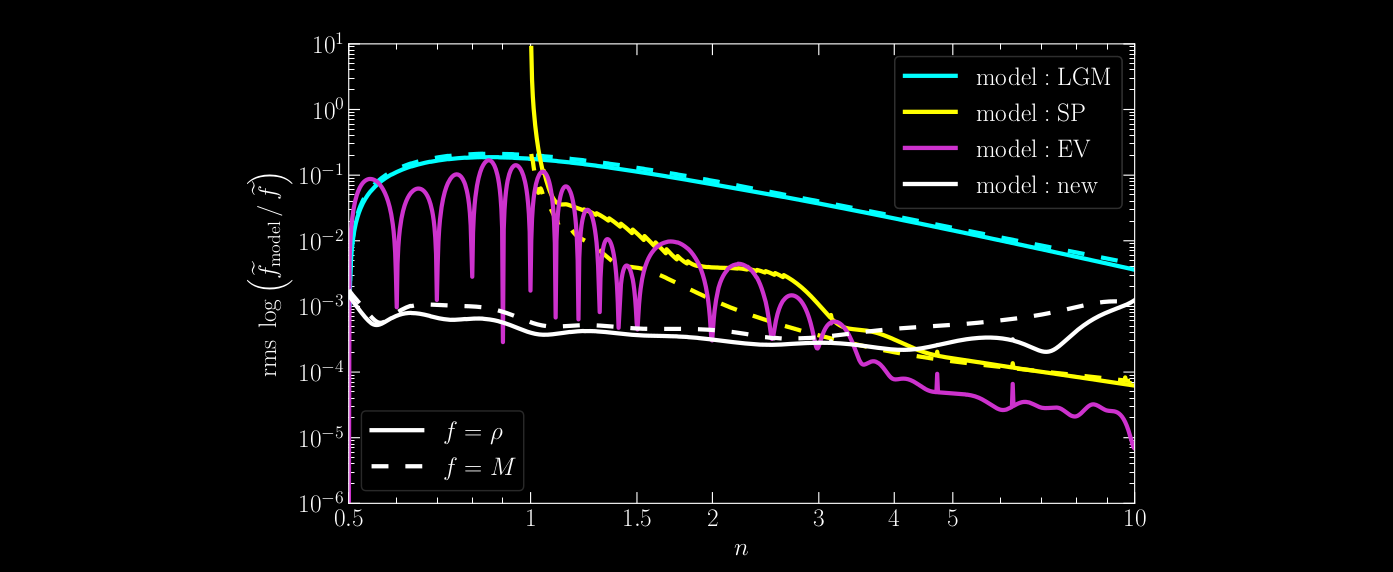 Accuracy of different approximations (LGM: Lima Neto et al. 1999; SP: Simonneau & Prada 1999,
2004; EV: Emsellem & van de Ven 2008) and our new one
(Vitral & Mamon 2020)
as a function of Sérsic index. We note that the EV model performs better at specific
values of n that are often missed in our logarithmic grid of 1000 values of n.
Accuracy of different approximations (LGM: Lima Neto et al. 1999; SP: Simonneau & Prada 1999,
2004; EV: Emsellem & van de Ven 2008) and our new one
(Vitral & Mamon 2020)
as a function of Sérsic index. We note that the EV model performs better at specific
values of n that are often missed in our logarithmic grid of 1000 values of n.
In Vitral & Mamon 2021, I have recalculated these coefficients for other regions of the n x Re domain, such that one can use different deprojections at each respective region where a deprojection is more performant. This hybrid approach is the most precise analytical deprojection of the Sérsic profile (supposing spherical symmetry), at least to the date when it was first used (i.e., 2021). It employs the deprojections from Lima Neto et al. (1999), Simonneau & Prada (2004), and the new coefficients (see further below) derived with the method from Vitral & Mamon 2020.
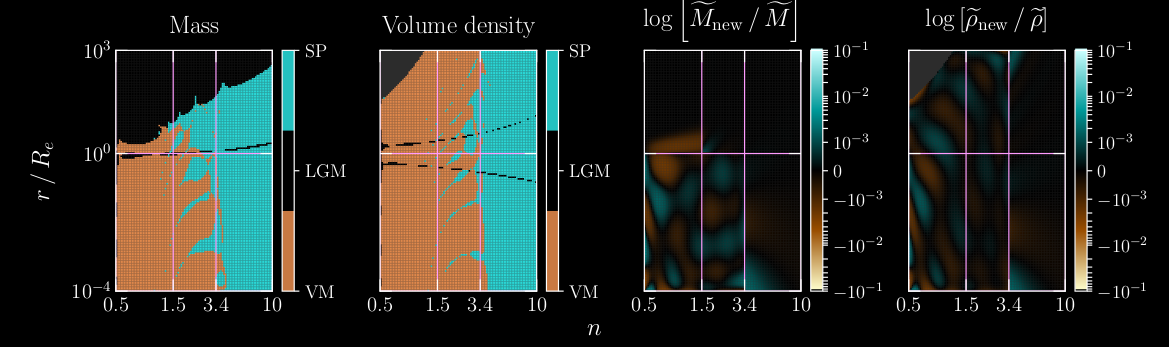 Characteristics of approximations to the mass and density profiles of the deprojected
Sérsic model. Left two panels: most precise approximation. SP stands for
Simonneau & Prada (2004), LGM stands for Lima Neto et al. (1999) and VM stands for the
new Vitral & Mamon 2021 coefficients applied to the Vitral & Mamon (2020) method. The white curves
indicate a thin region preferred by the LGM approximation. Right two panels:
accuracy of deprojected mass (left) and density (right) of the hybrid model using VM
coefficients, LGM99 and SP04, with respect to the numerical integration done with Mathematica.
This is the analog of Fig. 3 of VM20: the color scale is linear for log ratios between −0.001 and
0.001 and logarithmic beyond. Both sets of figures employ a [100 × 150] grid of
[log n × log(r/Re)], which is shown in all four panels. The gray region in the upper
left of each of the density panels is for regions where the numerical integration of
Mathematica reached the underflow limit because of the very rapid decline of density
at large radii for low n.
Characteristics of approximations to the mass and density profiles of the deprojected
Sérsic model. Left two panels: most precise approximation. SP stands for
Simonneau & Prada (2004), LGM stands for Lima Neto et al. (1999) and VM stands for the
new Vitral & Mamon 2021 coefficients applied to the Vitral & Mamon (2020) method. The white curves
indicate a thin region preferred by the LGM approximation. Right two panels:
accuracy of deprojected mass (left) and density (right) of the hybrid model using VM
coefficients, LGM99 and SP04, with respect to the numerical integration done with Mathematica.
This is the analog of Fig. 3 of VM20: the color scale is linear for log ratios between −0.001 and
0.001 and logarithmic beyond. Both sets of figures employ a [100 × 150] grid of
[log n × log(r/Re)], which is shown in all four panels. The gray region in the upper
left of each of the density panels is for regions where the numerical integration of
Mathematica reached the underflow limit because of the very rapid decline of density
at large radii for low n.
For the mass profile we used
- n x r/Re ∈ [0.5;1.5] x [1;103]: LGM.
- n x r/Re ∈ [0.5;3.4] x [10-4;1): VM, with coefficients from Vitral & Mamon 2021.
- n x r/Re ∈ (3.4;10] x [10-4;1) ⋃ (1.5;10] x [1;103]: SP.
For the density profile, the division was even simpler:
- n x r/Re ∈ (3.4;10] x [10-4;103]: SP
- n x r/Re ∈ [0.5;3.4] x [10-4;103]: VM, with coefficients from Vitral & Mamon 2021.
The ai,j coefficients from Vitral & Mamon 2021, which were calculated for the intervals of n ∈ [0.5;3.4] and r/Re ∈ [10-4;103] can be accessed below: